Category Archives: Technology and Math

“Hey, ChatGPT: Write me a blog post about how to effectively use ChatGPT when teaching Mathematics”

Disclaimer: The following is written by ChatGPT

——————————————

Mathematics is one of the fundamental subjects that many students struggle with. As a language model trained by OpenAI, ChatGPT can be a useful tool for educators to help their students learn math concepts effectively. In this blog post, we will discuss how to use ChatGPT to teach mathematics.

  1. Use ChatGPT as a math tutor ChatGPT can be an excellent math tutor for students who need extra help. By using natural language processing, ChatGPT can understand student’s questions and provide answers in an easy-to-understand way. Students can ask questions on various topics such as algebra, geometry, calculus, and ChatGPT will provide accurate answers.
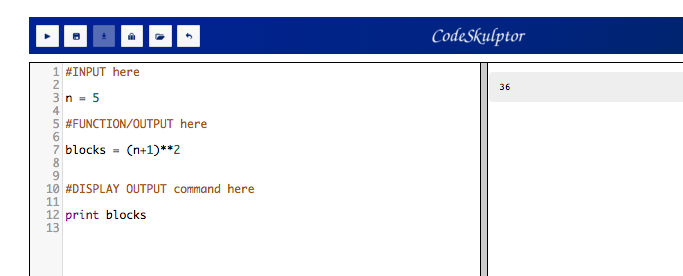
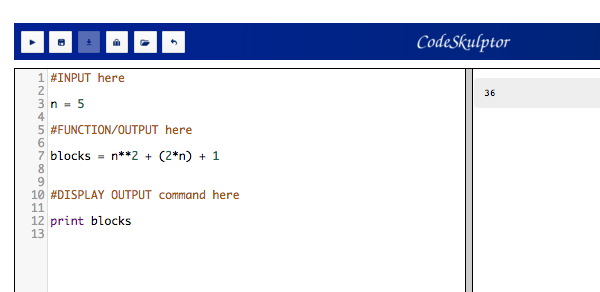
  2. Use ChatGPT to explain difficult concepts Math can be a difficult subject, especially when it comes to understanding complex concepts. ChatGPT can help teachers explain difficult math concepts by breaking them down into simpler terms. Teachers can input complex math problems or equations into ChatGPT, and it will generate step-by-step explanations. This will help students understand how to solve complex problems.
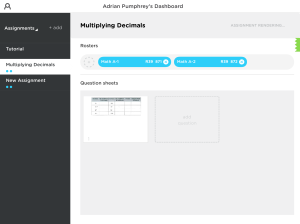
  3. Use ChatGPT to provide practice problems Practice is essential in learning math. Teachers can use ChatGPT to provide practice problems for students. Teachers can input a specific type of problem, and ChatGPT can generate multiple variations of that problem. Students can then practice solving these problems and get instant feedback from ChatGPT.
  4. Use ChatGPT to provide real-world examples Students often find it challenging to connect math concepts to the real world. Teachers can use ChatGPT to provide real-world examples that students can relate to. For example, ChatGPT can provide examples of how algebra is used in finance, or how geometry is used in architecture. These examples will help students understand how math concepts are used in the real world.
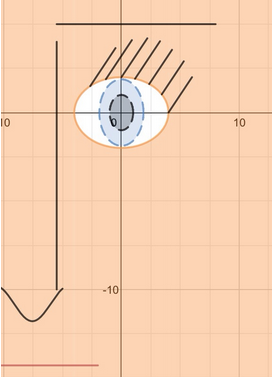
  5. Use ChatGPT to keep students engaged Students often find math boring and uninteresting. Teachers can use ChatGPT to make math more engaging for students. ChatGPT can generate fun and interactive math games that students can play. Teachers can also use ChatGPT to create math challenges for students to solve. These challenges can be used as part of a classroom activity or homework assignment.

In conclusion, ChatGPT can be an effective tool for teaching mathematics. By using ChatGPT as a math tutor, explaining difficult concepts, providing practice problems, providing real-world examples, and keeping students engaged, teachers can help students learn math concepts effectively. As a language model, ChatGPT can provide accurate answers and generate engaging math activities that will make learning math more enjoyable for students.


Thoughts? Write your response in the comments section below.

Visual Patterns and Coding – Part 2 – Exponential and Inverse Relationships

Screen Shot 2015-12-07 at 11.26.00 AM.png

Once we have got to grips with the basics of using python to create ‘visual pattern calculators’, it is time to take our thinking to the next level. Up to now we have only been looking at linear relationships with a straight line graph.

The visual pattern above is a quadratic relationship as the pattern grows in a linear fashion in two directions (It’s useful to talk separately about the width vs. length and then bring them together). The nth term is either (n+1)^2 or n^2+2n+1. Can you see both in the picture?

Let’s pause for a second. In 6th grade, I can use visual patterns to introduce the idea that a quadratic has two linear factors! I had HS seniors that struggled with this idea. I love this!

Next comes the coding. Again, we use CodeSkulptor to ‘skulpt’ our function in three lines: Input, Function/Output, and the display output command. The difference in this is that for exponents we have to use **.Screen Shot 2015-12-07 at 11.28.42 AM.png

OR:

Screen Shot 2015-12-07 at 11.29.17 AM.png

Also, I get the students to Desmos to see if their prediction of the graph are correct. This brings up great discussions about why the graph is the shape it is in quadrants two and three.

Screen Shot 2015-12-07 at 11.31.57 AM.png

OR:

Screen Shot 2015-12-07 at 11.32.12 AM.png

I have also introduced the idea of an inverse function; using python to create a function that would enable us to answer the question: What step would contain 400 blocks? This forces the student to consider inverse operations and the fact that order matters. Here is the code (python reads from top to bottom so you can include this all in the one program):

Screen Shot 2015-12-07 at 11.30.49 AM.png

The benifit of this has been less about coding or nth term and more about introducing the composition of functions. It also enabled me to run some rich lessons on the topic of ‘Straight Line vs. Curvey Lines – Who Cares’ exploring linear vs. exponential relationships with finance and population growth.

The effects of this series will not be truly measured until these students take Algebra, next year. However, my hope is that this will have given them a solid foundation for many of the concepts that they will study in the coming years. We’ll see…

Visual Patterns and Coding – Part 1 – Linear Relationships

Screen Shot 2015-11-30 at 12.18.45 PM.png

I have been running a ‘visual pattern’ every week with my 6th grade (pre-Algebra) classes. You can read more about this here.

To bridge the gap between pattern and function and following an online course I took with Rice University, I have started to introduce some basic coding. Python in particular. Even after one lesson of using coding and graphing, I have been able to have rich conversations about the differences between functions, input/outputs, the shape of a graph and the y-intercept. Here is the process I have taken them through:

Part 1: Have the students run through a basic (linear) visual pattern (from visualpatterns.org) using this sheet and reviewing using this slide:

Screen Shot 2015-11-30 at 12.03.09 PM.png

The nth term for this pattern is 4n+1.

Part 2: I now challenge them that we can create a calculator for this pattern using the Python coding language. I use the free python interface CodeSkulptor (from Rice University) to do this. I take them through step-by-step with some great conversations about functions and inputs/outputs.

The nice thing about CodeSkulptor is that when you hit the save button, it creates a brand new URL meaning that each student will have their own URL to post and share.

Screen Shot 2015-11-30 at 12.06.46 PM.png

They can then change the input and see clearly what happens to the output.

(Note: Lines with # are ignored by the interface)

Part 3: They then go to the Desmos Online Graphing Calculator and input the function y = 4x+1 to confirm or deny their prediction for the graph shape, from the start of the exercise. This is a great opportunity to talk about ‘step zero’ (as well as step -10 etc.) and why they graph is the shape that it is. I feel it is also important to stress the difference between 4n+1 as an nth term and y=4x+1 (which includes everything in between).

Screen Shot 2015-11-30 at 12.10.55 PM.png

Their homework is simply to follow the steps with a different (linear) visual pattern and to share their CodeSkulptor URL’s and Desmos screenshots on the class’ wiki page.

For student assistance I created this video:

Where Next?

There are two main places that I would like to take this:

  • Exponential functions
  • Inverse functions

I’m really excited about where this journey will take us. My hope is, that as these students start Algebra proper, next year, they will have a strong sense of functions graphs and their connections with patterns and geometry. Here goes…..

Have you done anything similar? I would love to hear your ideas/thoughts in the comments section, below.


Top Tech Tip – Rowmote Pro iPhone app ($4.99)

Screen Shot 2015-02-25 at 1.59.59 PM  Screen Shot 2015-02-25 at 1.59.53 PM

I avoid my desk whenever possible during a class and like to be moving around or up at the board. This proves difficult when my computer and powerpoints are at the back of the room and I need to change between slides. Of course I can just buy a clicker (good ones fetch $50-70). However, I looked at the app store and found Rowmote Pro ($4.99), an app that not only works as a clicker but does pretty much everything your keyboard and mouse can do.

I’ve just finished a unit on spreadsheets and scatter plots and I was able to be at the board or walking around the room the whole time whilst working a functioning spreadsheet. It was awesome.

There aren’t many apps I can say this of (if any) but I now use Rowmote Pro in every lesson and it means I can be where I want to be at any point during the lesson.

What apps make your teaching life easier?

Classkick Review – Thoughts from the first day

I first heard about Classkick through Dan Meyer’s blog and thought ‘I have to give this a try!’ The idea is simple but the implications could be huge. A platform that lets you see what students are thinking and writing, in real time! It is so simple I can’t believe it hasn’t been done before.

photo 5photo 4

So, as soon as I finished reading the article, I downloaded it onto my iPad and emailed my students to do the same ready for the next day. I didn’t want to go another day in my classroom without trying this out.

The punchline: It’s a great idea, but it needs some work.

The interface is clean and pleasant to use. The tutorial videos are helpful as some elements are more intuitive than others. For example, i assumed that students would sign up once to a class and after that would stay signed in (as is the case for many other education apps). But with Classkick, students will sign in to each assignment you set, separately with a different code. I think this could get a little cumbersome when I am setting activities every lesson.

The idea behind the app is phenomenal and when it worked it was magical. To be able to see what students are writing, provide immediate feedback and pointers is a very powerful tool. This could be used for in class work or for homework.

The students loved knowing that I could see their work, I could give them instant feedback and they responded very positively. They jumped into the learning from my feedback. I could not only look at their answers but circle and ask questions about mistakes in their thought processes. This is so exciting!

photo 1photo 2

However, on first use I did find the app a little slow, at least from the teachers side of things. In one lesson it took around 4 minutes for the students’ work to appear on the screen when the network was working just fine. Sometimes it took a while to recognize my writing, impeding my ability to give as many students as I could, feedback. It can also take a little getting used to writing with a stylus. I found if I wrote too quickly, it simply didn’t recognize my writing at all.

This is a new app; there are going to be bugs. I for one am excited to stick with it as the wrinkles are ironed out or I find something that is doing the same thing but better. One day, this sort of app will be part of every classroom and hopefully, very soon indeed. The best of luck to the Classkick team!

Virtual Filing Cabinet 1.0

I trawled, I tweeted, I tried to find the best of what was out there. I have posted the first draft of my virtual filing cabinet here and in the process, learned the following:

  • There are so so many great lessons and activities out there!
  • There are far too many to include them all
  • It is hard to choose which ones to include
  • There are some incredible teachers who I would like to be more like
  • I’m really excited about trying just a handful of things I found
  • I want to do a lot more project based lessons
  • This is a working document and will evolve with my teaching

If you haven’t already I highly recommend you trawl some websites and create one of these yourself. Chances are, it will be unique to you and your teaching style and philosophy. Here is a list of websites to get you started. 

Let me know if you think there are any glaring emissions.

Gapminder is Awesome

photo (9)

I wanted something that would open up the world of scatterplots to my statistics students; something where they could really get a sense of correlation and causality. I decided to do a project based around the fantastic GapMinder World and it payed off.

First I showed this video of the master Hans Rosling at work with the graphs his foundation came up with.

I then gave these instructions to my students:

You (and max one other person) are to prepare a 3 minute presentation on a GapMinder graph of your choice.

Instructions:

  • On a computer go to the gapminder website by clicking here
  • Play around with the explanatory and response variables until you find two that you think show some sort of relationship
    • If you are struggling to find variables with a link, click ‘Open Graph Menu’ and play around with graphs that have already been created.
  • Your presentation must include answers to the following questions
    • What are your explanatory and response variables?
    • What is the link between variables at the start (before you click play)?
    • What do you notice happens over time?
    • Are all the countries close together or more spread out? What does this mean?
    • Are there changes to any particular country that are of interest to you?
    • What if you isolate by continent? Are there any changes that are of interest to you?
    • Is there anything else that stands out with your graph?
    • Are there any outliers to the trend?
    • Does this graph bring up any other questions that you would want to investigate further? What information would you need to answer these questions? Is this information available?

Your presentation must include the time series animation (when you press play) as well as PowerPoint slides using screen shots of points of interest.

You will be graded on:

  • Content (out of 6)
  • Presentation (out of 4)
What went well
  • This was a great way to get across a sense of scatter graphs and will be awesome to segway into taking about correlation and causality.
  • This was enjoyed by the students and really got them thinking about statistics and global affairs
  • It was good to give specific questions for the students to answer. In my experience just saying ‘present for 3 minutes on a graph of your choice does not give great results’
Even Better If

Next time I do this, I think it would be good to model what an excellent presentation looks like. I missed a good opportunity to teach this skill.

Desmos is Awesome

I love Desmos. I love how user-friendly and clean the whole thing is. I want my students to love it too, so I used the first lesson back after midterms to let them play.

The Aim

For my students to get a feel for the shape of various functions and relations through using Desmos to create a piece of art. (CC Standard F.BF.3)

The activity

  • Students take a look at http://www.desmos.com/art to see what is possible just by typing in equations (Great hook)
  • I explain to students that they have this lesson and a homework to come up with a piece of art of their own using desmos.com/calculator.
  • I have a sheet ready with some example functions (linear, quadratic, circular relations, radical and rational) for them to use if they are struggling. I also introduce the idea of sliders for them to use.
  • They have around 50 minutes plus a homework to come up with a piece of art of their own.

DesmosActivity


Some of the resultant artwork

Football FaceHalf Face

What went well

  • Any lesson where students are crying out for the Math is a good thing. It was amazing to be asked how to draw a smiley face using a parabola and domain and range and how to draw circles and ellipses. I had one student ask how to do a ‘diagonal porabola!’ I had to look that one up.
  • Students were constantly engaged. Sometimes frustrations got the better of them and they needed some encouragement to keep going but generally, the lesson went really fast.
  • It was great for all abilities. Students that normally struggle got the chance to play around with linear and quadratic functions, helping them to understand what changing the numbers did to the graph.

Even better if

  • This was too early in the year to do this lesson. I would like to do this next time at the end of the year when students had more functions and tools at their finger tips. I did like how it cemented the need for domain and range, though.
  • This lesson is leading into our quadratics unit. Going back I would have really liked to focus far more on parabolas so that our next lesson on Vertex Form would make sense from the start. I still think it will help, I just think I may have missed an opportunity to go deep rather than broad.
  • This lesson relies heavily on technology. Being a Bring-Your-Own-Device school, some students had tablets that were very tricky to use (this also happened with Khan Academy). I may have to rethink how I do this and use it possibly for homework.

Student Reaction

Here are results from a mini survey I did at the end of each class

DesmosSurvey1

Students also said:

This activity allowed me to visualize what adding variables does to the shape of an equation.

I loved the creativity involved with it, but also the brain work involved when trying to make different shapes and move them around.

Technical difficulties were frustrating, but I realize this is something that is hard to fix.