Once we have got to grips with the basics of using python to create ‘visual pattern calculators’, it is time to take our thinking to the next level. Up to now we have only been looking at linear relationships with a straight line graph.
The visual pattern above is a quadratic relationship as the pattern grows in a linear fashion in two directions (It’s useful to talk separately about the width vs. length and then bring them together). The nth term is either (n+1)^2 or n^2+2n+1. Can you see both in the picture?
Let’s pause for a second. In 6th grade, I can use visual patterns to introduce the idea that a quadratic has two linear factors! I had HS seniors that struggled with this idea. I love this!
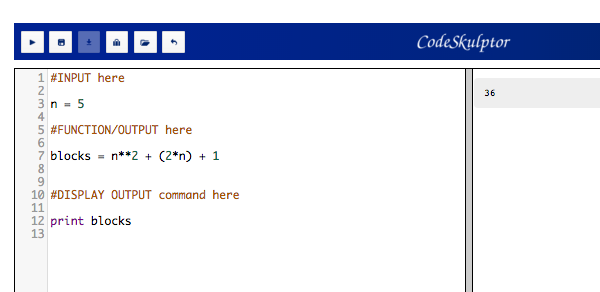
Next comes the coding. Again, we use CodeSkulptor to ‘skulpt’ our function in three lines: Input, Function/Output, and the display output command. The difference in this is that for exponents we have to use **.
OR:

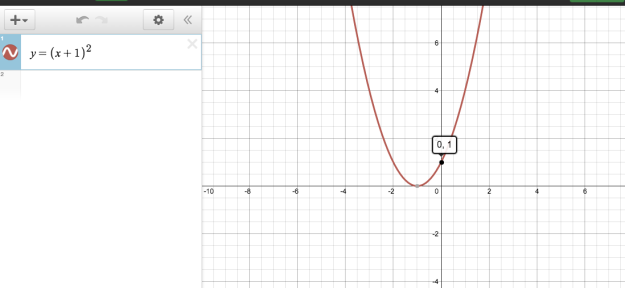
Also, I get the students to Desmos to see if their prediction of the graph are correct. This brings up great discussions about why the graph is the shape it is in quadrants two and three.

OR:

I have also introduced the idea of an inverse function; using python to create a function that would enable us to answer the question: What step would contain 400 blocks? This forces the student to consider inverse operations and the fact that order matters. Here is the code (python reads from top to bottom so you can include this all in the one program):

The benifit of this has been less about coding or nth term and more about introducing the composition of functions. It also enabled me to run some rich lessons on the topic of ‘Straight Line vs. Curvey Lines – Who Cares’ exploring linear vs. exponential relationships with finance and population growth.
The effects of this series will not be truly measured until these students take Algebra, next year. However, my hope is that this will have given them a solid foundation for many of the concepts that they will study in the coming years. We’ll see…

This is what happens when you take a high school math teacher and put them in junior high: lots of deep stuff taught in junior high. Very impressed!